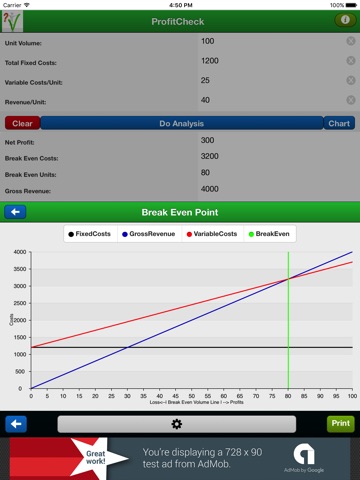
ProfitCheck app for iPhone and iPad
Developer: EA-BPM Strategies LLC
First release : 12 Oct 2011
App size: 81.41 Mb
ProfitCheck enables estimating the point when an enterprise becomes profitable. In other words, the break-even point when gross revenue equals costs after which profitability begins.
How many times have you had an idea to create a new product or undertake a project and needed a tool to bring the idea into perspective quickly? Skip using spreadsheets, textbooks, or other cumbersome analytics to quickly answer your most important questions about balancing costs and revenue to achieve a profit.
“ProfitCheck” uses four simple inputs to determine a solution. These inputs are, "Unit Volume", "Total Fixed Costs", "Variable Costs/Unit", and "Revenue/Unit". In addition, ProfitCheck graphs the solution providing a visual representation of costs vs. revenue relationships and provides a "green" vertical line where costs and profits break even.
Inputs:
-Enter Unit Volume
-Enter Total Fixed Costs
-Enter Variable Costs per Unit
-Enter Revenue per Unit
Outputs:
-Total Variable Costs
-Break Even Costs
-Break Even Units
-Gross Revenue
-Net Profit
Features:
-Solution graphing showing intersecting relationships of inputs
-Identifies negative profit
-Print screen shots of inputs, analysis, and break-even point graph


